One of the most insidious bugs in enterprise dashboards is not a crash, not a null pointer, and not a failed query. It is a number that is simply wrong — and worse, wrong in a way that looks plausible.
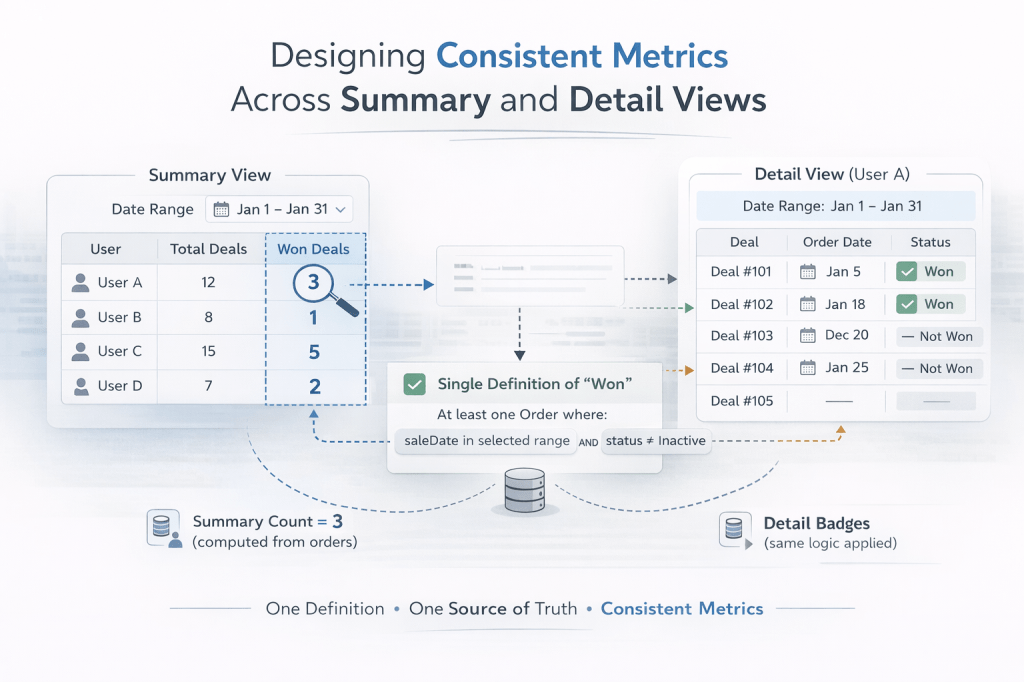
You build a summary table that shows a user has 1 won deal. You click that row and a detail table expands showing all their leads. Two of them have a green “Won” badge. The business user stares at the screen and asks: “Which one is right?”
This article is about why that happens, and how to design your way out of it.
The Problem: Two Views, Two Definitions
In most enterprise web applications, summary views and detail views are built independently and at different times. The summary table is often built first — it runs an aggregation query and shows counts. The detail table comes later — it renders individual records and uses field-level flags to show status icons.
The problem is that the same business concept ends up being computed two different ways:
- The summary query might define “won” as: a deal that has an associated order with a sale date within the selected date range and a status that is not Inactive.
- The detail view might define “won” as: a deal whose
leadStatusfield equalsWON.
Both definitions are reasonable in isolation. But they measure different things. A deal can have leadStatus = WON without having an order in the current date range. An order can exist in the date range for a deal whose leadStatus was never updated. The two views drift apart silently, and no test catches it because both queries execute without errors.
Why This Happens in Practice
1. Summary queries are written by different people (or at different times)
Aggregation queries for summary tables tend to be written with business reporting in mind. They join to orders, apply date filters, and count carefully. Detail views tend to be written with display in mind — “show me all leads for this user” — and use whatever status flag is on the entity.
2. Status flags and transactional records diverge
In many systems, a “won” status lives in two places:
- A status flag on the entity (
leadStatus = WON) updated manually or via a workflow. - A transactional record in a related table (an
Orderwith asaleDate).
These two can get out of sync. A deal might be marked WON before the order is created. An order might be created in one date range while the leadStatus flag was set in another. Neither is wrong — they represent different moments in the business process.
3. Date range filters are applied inconsistently
Summary views almost always have a date range filter. Detail views often show all records for a user without applying the same filter to the status icons. So a deal won six months ago still shows a “Won” badge in a detail view filtered to this month — inflating the visible count relative to the summary.
The Core Principle: One Definition Per Metric
The fix is not technical — it is architectural. Every business metric must have exactly one definition, and all views that display that metric must use the same definition.
This sounds obvious. It is surprisingly hard to enforce in practice.
A metric definition should specify:
- The data source — which table or entity is the source of truth?
- The conditions — what field values or related records qualify a record for this metric?
- The date field — if the metric is date-range-sensitive, which date field is used?
- The scope — does the metric apply globally, or within a specific date range?
For example, a well-defined “Won” metric might be:
A deal is counted as Won in a given date range if and only if it has at least one associated Order where
saleDatefalls within the range andstatus != 'Inactive'.
Once you have that definition written down, every query — summary or detail — must implement exactly that logic.
Practical Patterns for Enforcing Consistency
Pattern 1: Centralize the metric logic in a single method or query
Do not let summary and detail views each write their own interpretation of “won”. Instead, create a single method that encapsulates the definition:
// Single source of truth for "won in range"public Set<Long> fetchWonDealIdsInRange(String userEmail, Date startDate, Date endDate) { return em.createQuery( "SELECT d.id FROM OrdersEntity o JOIN Deal d ON o.leadId = d.id " + "WHERE o.status <> 'Inactive' " + "AND o.saleDate >= :startDate AND o.saleDate < :endDate " + "AND d.leadGeneratedBy = :userEmail", Long.class) .setParameter("startDate", startDate) .setParameter("endDate", endDate) .setParameter("userEmail", userEmail) .getResultList() .stream() .collect(Collectors.toSet());}The summary table uses this to count. The detail view uses this to decide whether to show the “Won” badge. Both call the same method. The definitions cannot drift.
Pattern 2: Pass context from the summary to the detail view
When a user clicks a row in the summary table, the detail view should receive not just the selected user, but also the same date range and filter context that the summary used. The detail view should then apply that context when rendering status icons.
In a JSF/PrimeFaces application, this means storing the date range in a shared controller field and passing it explicitly when populating the detail table:
public void onUserRowSelect() { // Pass the same date range used by the summary Date start = reportDateRange.get(0); Date end = reportDateRange.get(1); currentLeads = leadFacade.fetchLeadsForUser(selectedUser, start, end); wonDealIds = leadFacade.fetchWonDealIdsInRange(selectedUser.getUsername(), start, end);}Then in the view:
<!-- Won badge uses the same definition as the summary Won count --><span style="#{leadController.isWonInRange(lead.id) ? '' : 'display:none;'}" title="Won (order in this date range)"> <i class="pi pi-check-circle"/></span>Pattern 3: Name your metrics precisely in the UI
Vague labels invite inconsistent implementations. If your summary column says “Won” and your detail badge says “Won”, developers will implement them however seems natural to them at the time.
Be specific in both the UI label and the code:
| Vague | Precise |
|---|---|
| Won | Won (order in date range) |
| Duplicate | Duplicate (flagged at entry) |
| Not a Lead | Not a Lead (sales review) |
Precise labels force you to think about the definition at the moment you build the feature, and they make discrepancies immediately visible to users rather than silently misleading them.
Pattern 4: Write a consistency test
Once you have a single definition, write a test that verifies the summary count and the detail count agree for a known dataset:
@Testpublic void wonCountInSummaryMatchesWonBadgesInDetail() { // Given: a user with 2 deals, only 1 has an order with saleDate in range setupTestData(); List<LeadStatsResult> summary = facade.fetchLeadStatsForUser( List.of("testuser"), startDate, endDate); Set<Long> wonIds = facade.fetchWonDealIdsInRange("testuser", startDate, endDate); assertEquals(1, summary.get(0).getWonCount()); assertEquals(1, wonIds.size());}This test will catch any future drift between the two implementations before it reaches production.
A Note on Status Flags vs. Transactional Records
The deeper issue in many of these inconsistencies is that status flags and transactional records are two different things, and conflating them leads to bugs.
- A status flag (
leadStatus = WON) is a snapshot of the current state of a record. It answers: “Is this deal won right now?” - A transactional record (an
Orderwith asaleDate) is an event in time. It answers: “Was this deal won during a specific period?”
For reporting purposes — especially date-range reports — you almost always want the transactional record, not the status flag. Status flags are useful for operational views (“show me all currently open leads”) but unreliable for historical reporting (“show me what was won in January”).
Design your data model with this distinction in mind, and make sure your reporting queries use the right source.
Summary
- Metric inconsistencies between summary and detail views are one of the most common and hardest-to-spot bugs in enterprise dashboards.
- They arise when two views implement the same business concept using different queries, different date fields, or different data sources.
- The fix is architectural: define each metric precisely (data source, conditions, date field, scope) and enforce that definition in a single shared method.
- Pass filter context (date range, user scope) from the summary view to the detail view so both operate on the same slice of data.
- Use precise UI labels to make definitions visible and to force consistency at build time.
- Write a consistency test that verifies summary counts and detail counts agree.
- Prefer transactional records over status flags for date-range reporting.
The next time a stakeholder says “the numbers don’t match”, the first question to ask is not “which query has a bug?” — it is “do both views agree on what this metric means?” Usually, they don’t. And that is the real bug.

Leave a comment